
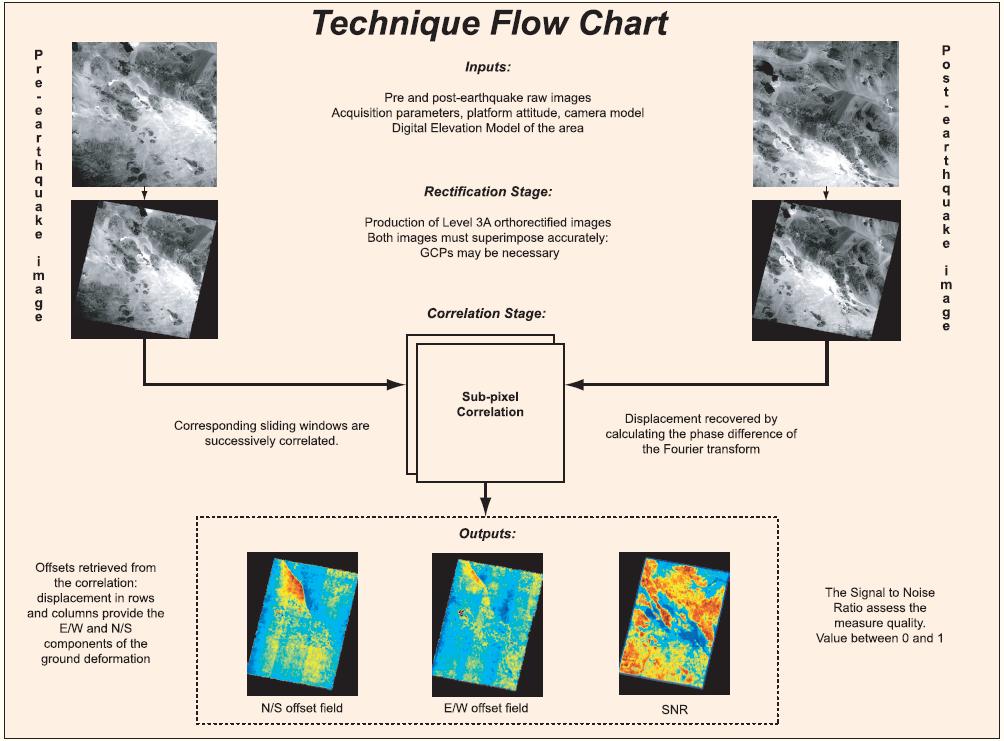
Research.In complement to seismological records, the knowledge of the ruptured fault geometry and of the co-seismic ground deformation are key data to investigate the mechanics of seismic rupture. This information can be retrieved from sub-pixel correlation of pre- and post-earthquake remotely sensed optical images. However, this technique suffers from a number of limitations, mostly due to uncertainties on the imaging systems and on the platform attitudes, leading to strong distortions and stereoscopic effects. Here, we propose an automated procedure that overcomes most of these limitations. In particular, we take advantage of the availability of accurate digital elevation models with global coverage (SRTM). This methodology will improve our ability to collect measurements of ground deformation, in particular in the case of large earthquakes occurring in areas with little or no local geophysical infrastructure. Measuring co-seismic deformations from remotely sensed optical images is attractive thanks to the operational status of a number of imaging programs (SPOT, ASTER, Quickbird, USGS-NAPP aerial programs, etc...) and to the broad availability of archived data. The general procedure consists of generating accurate ground control points (GCP) for each image. An accurate ortho-rectification model is then built, which allows accurate ortho-rectification and co-registration of the set of images. Correlation on the ortho-rectified images then delivers the horizontal ground displacements to analyze. |
The algorithms
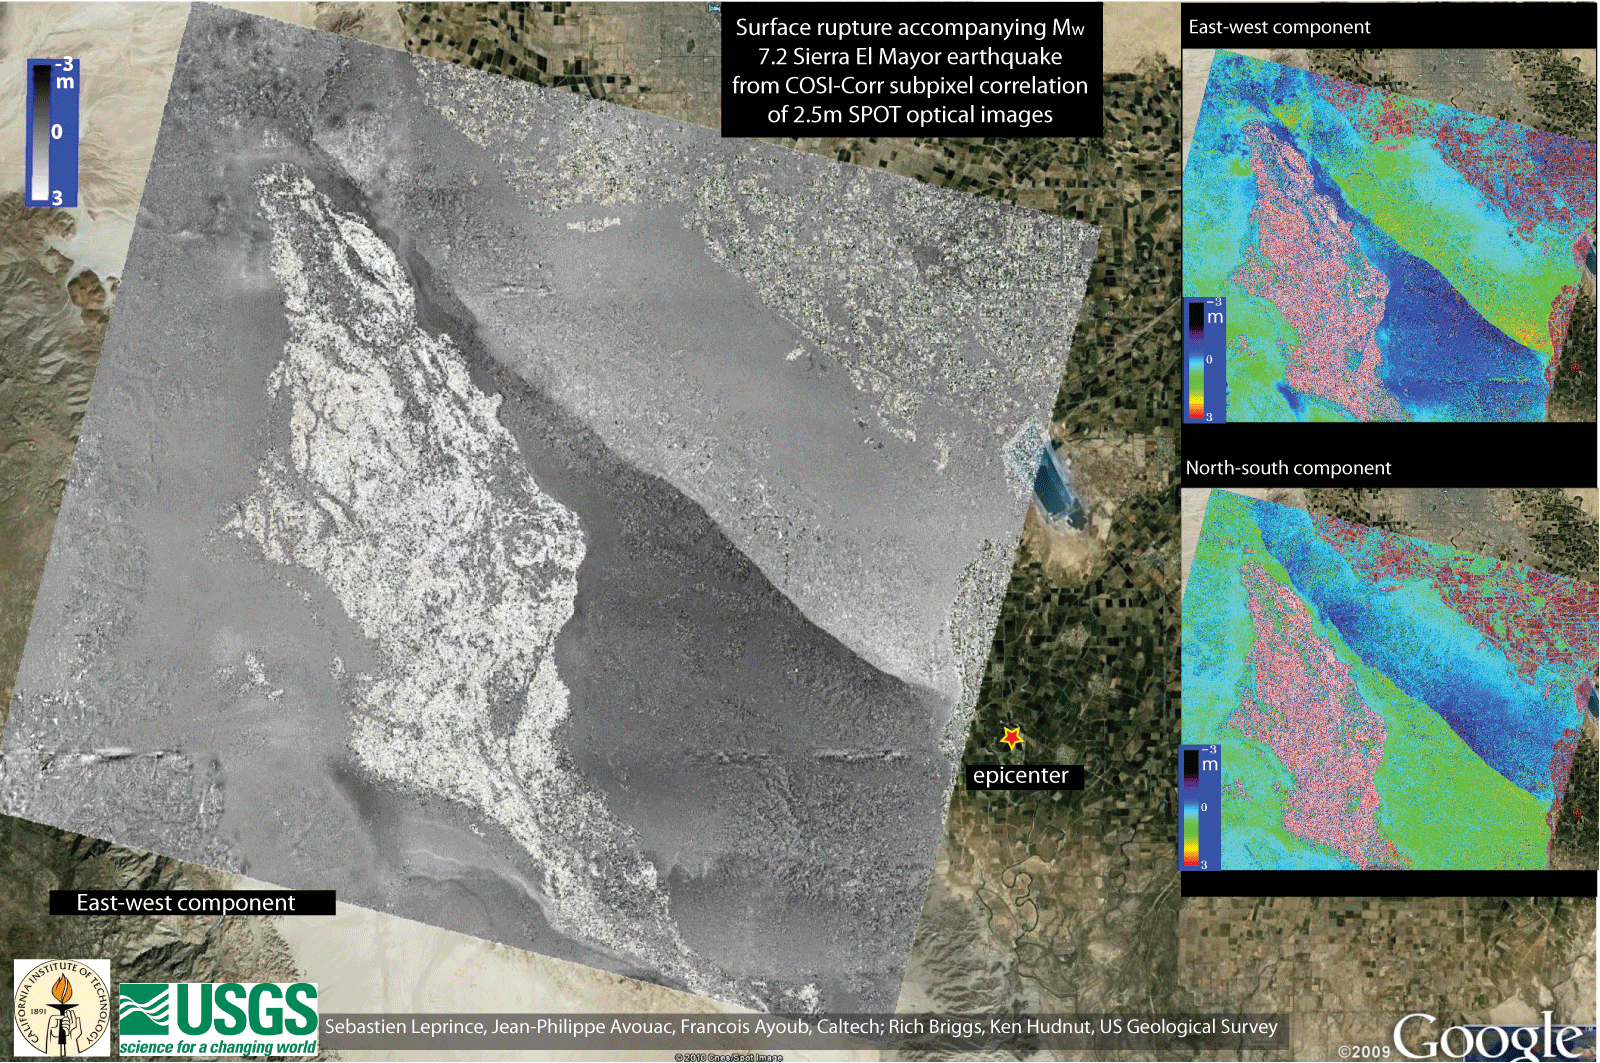
described in this study have been implemented in a software package,
COSI-Corr (Co-registration of Optically Sensed Images and Correlation),
developed with IDL (Interactive Data Language) and integrated under
ENVI. It allows for precise ortho-rectification, co-registration
and correlation of SPOT and ASTER satellite images as well as aerial
photographs.
User's Guide COSI-Corr is now available.The COSI-Corr discussion Forum is now open. |
|
|||||||||
|
31 Mar 2010 Caltech public lecture Modern Methods of Observing Earthquakes: What We Have Learned About Haiti and Chile using Seismology and Space Observations - Fox News coverage - Video of public lecture |
|||||||||
| 15
Dec 2008 An EarthSky Extended Podcast Jean-Pilippe Avouac on earthquakes EarthSky’s Jeremy Shere talked with geologist Jean-Philippe Avouac about how he uses satellite imagery to study earthquakes... link to listen or download |
|||||||||
22 Oct 2008 NASA Earth Observatory When the Earth Moved Kashmir Kashmir lies atop a web of active geological faults with underground dynamics that rival the complexities above ground. On October 8, 2005, one of the faults gave way, resulting in a magnitude 7.6 earthquake...link to article |
|||||||||
25 Jan 2008 Arroyo Monthly Snapshots From Space ...There is no doubt that Google Earth is a true cultural phenomenon, but that sort of technology has a lot more to offer than mind-blowing cubicle excursions. Sebastien Leprince, a graduate student in electrical engineering at Caltech, recently developed similar software under the guidance of geology professor Jean-Philippe Avouac. He designed it for geoscientists monitoring natural disasters...link to article |
|||||||||
| 12/2007 Caltech Media Release Tracking Earth Changes with Satellite Images SAN FRANCISCO, Calif.--For the past two decades, radar images from satellites have dominated the field of geophysical monitoring for natural hazards like earthquakes, volcanoes, or landslides. These images reveal small perturbations precisely, but large changes from events like big earthquake ruptures or fast-moving glaciers remained difficult to assess from afar, until now...link to article |
|||||||||
 9/2006 9/2006Science, Editors' Choice: The Big Dig Avouac et al. show the Mw 7.6 Kashmir earthquake rupture broke through to the surface. |
 8/2006 8/2006Nature, Research Highlights: Satellite maps faultline Researchers use readily available satellite photographs to measure ground deformation caused by large earthquakes. |
||||||||
© 2004 Tectonics Observatory :: California Institute of Technology :: all rights reserved