Backprojection Result
3/11/2011 (Mw 9.0), Tohoku-oki, Japan
Lingsen Meng and Jean-Paul Ampuero (Caltech).
Overview
We imaged the source of the March 11 2011 M9.0 earthquake in Japan by back-projection of the seismic waveforms recorded by large arrays at teleseismic distance. This source imaging technique allows to track the location and migration of the multiple sources of high-frequency radiation that compose an earthquake rupture front. Our particular approach is based on high-resolution array-processing techniques, such as MUSIC (Mutiple Signal Classification -- Schmidt et al,1982; Goldstein and Archuleta,1991) and CINT (Coherent INTerferometry -- Fletcher et al, 2006; Borcea et al, 2005).These techniques achieve higher resolution than conventional beamforming and are more robust against aliasing.
Data selection and processing
We applied the MUSIC and CINT back-projection techniques to seismic data recorded by the USArray at epicentral distances between 70 and 90 degrees, filtered between 0.5 and 1 HZ within 10 seconds long sliding windows. The large aperture of the USArray in the radial direction provides good spatial resolution along-strike despite its unfavorable source-array direction sub-parallel to the trench axis. Test were also performed using a network of seismological station in Europe (Figure 3) or New-Zealand. The warm colors in the movies (Figures 1 and 2) correspond to high amplitudes of the MUSIC pseudo-spectrum and of the network-averaged cross-correlation coefficient, respectively. They indicate the location of the major areas of high-frequency radiation on the fault. The white star is the mainshock epicenter and the white dots are the epicenters of M>6 foreshocks and aftershocks from NEIC. The white line is a reference along-strike direction on which we project these images to produce the spatio-temporal view of the rupture shown in Figures 4 and 5.Results
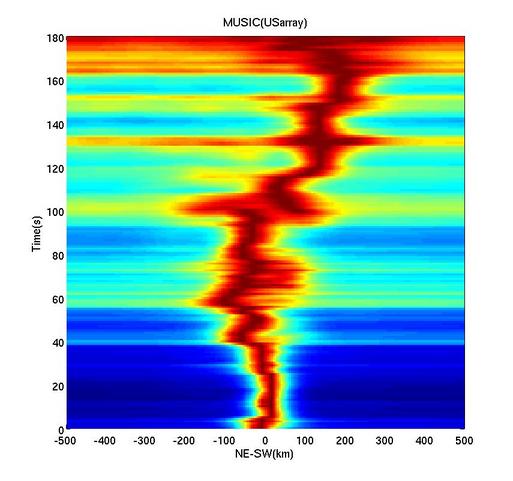
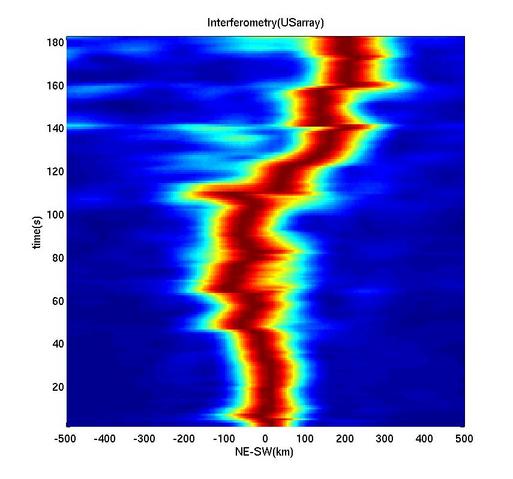
In the initial 100 seconds the rupture propagates slowly to the North and down-dip. Around 100 seconds into the event, two rupture fronts split up. The southward propagating rupture becomes dominant and sustained until 170 seconds.The averaged rupture speed to the south is 2.8 km/s. These features can also be discerned, although with lower resolution, in our back-projection images based on data from Europe (figure 3) and New Zealand.MUSIC back projection (USArray)
Coherent interferometry (USArray)
Figure 2: The warm colors correspond to high amplitudes of the network-averaged cross-correlation coefficient using USArray data. They indicate the location of the major areas of high-frequency radiation on the fault. The white star is the mainshock epicenter and the white dots are the epicenters of M>6 foreshocks and aftershocks from NEIC. The white line is a reference along-strike direction on which we project these images to produce the spatio-temporal view of the rupture shown in figure 5.
MUSIC back projection (dense European network)
Figure 3: Using the dense seismic network in Europe, the resolution on the propagation of the rupture is similar to what we achieve with the USarray. In particular, Europe is oriented at near perpendicular to the japanese trench, which is more favorable than the USarray. The warm colors correspond to high amplitudes of the MUSIC pseudo-spectrum. They indicate the location of the major areas of high-frequency radiation on the fault. The white star is the mainshock epicenter and the white dots are the epicenters of M>6 foreshocks and aftershocks from NEIC.
Projection on the fault trace (MUSIC)
Projection on the fault trace (CINT)
References
Schmidt, R. "Multiple emitter location and signal parameter estimation," Antennas and Propagation, IEEE Transactions , vol.34, no.3, pp. 276- 280, Mar 1986
doi: 10.1109/TAP.1986.1143830
Goldstein, P. and R. J. Archuleta (1991). Deterministic Frequency-Wavenumber Methods and Direct Measurement of Rupture Propagation During Earthquakes Using a Dense Array: Theory and Methods,J. Geophys. Res. , 96, 6173-6185.
Borcea, L., Papanicolaou, G. C., Tsogka (2006) Adaptive interferometric imaging in clutter and optimal illumination , Inverse Problems,Inverse Problems , 22, pp. 1405-1436.
Fletcher, Jon, B., Paul Spudich, and Lawrence M. Bakeri (2006) Rupture Propagation of the 2004 Parkfield, California, Earthquake from Observations at the UPSAR,Bulletin of the Seismological Society of America , 96: S129 - S142.
Goldstein, P. and R. J. Archuleta (1991). Deterministic Frequency-Wavenumber Methods and Direct Measurement of Rupture Propagation During Earthquakes Using a Dense Array: Theory and Methods,
Borcea, L., Papanicolaou, G. C., Tsogka (2006) Adaptive interferometric imaging in clutter and optimal illumination , Inverse Problems,
Fletcher, Jon, B., Paul Spudich, and Lawrence M. Bakeri (2006) Rupture Propagation of the 2004 Parkfield, California, Earthquake from Observations at the UPSAR,
‹Back to Slip Maps for Recent Large Earthquakes home page
© 2004 Tectonics Observatory :: California
Institute of Technology :: all rights reserved