April/04/2010 (Mw 7.2), El Mayor-Cucapah, Mexica
Shengji Wei (Caltech) and Anthony Sladen (Geoazur-CNRS)
Location of Epicenter |
Overview
|
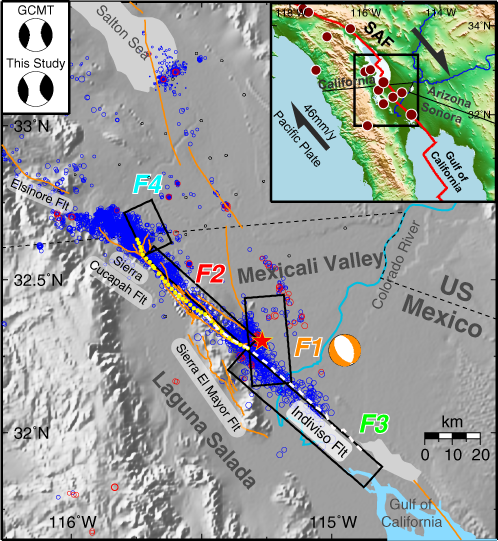
The El Mayor-Cucapah earthquake is located at the boundary between the Pacific plate and the North American plates. These plates are sliding at about 5 cm/year.The inset figure shows the plate motion and the main rupture zone. The red dots indicates historical large earthquakes.
The earthquake was initialed as a normal event on segment F1 (orange beach ball), then triggered the rupture on two anti-dipping faults(F2 and F3) and propagate bilateral, i.e., it spread away from the epicenter in both the northwest and southeast directions, taking about 30 seconds to cover a total rupture length of ~120 km (~75 miles). The rupture originated about 6 km (4 miles) below the surface and indicated as the red star. Active faults in this region are shown as orange lines, and the blue circles are the relocated aftershocks. GCMT solution and the point source approximation of this study are shown on the upper left corner. Yellow and white dots denote surface ruptures determined from correlation of optical and SAR images. Please see Wei et. al. (2011) for more details. |
DATA Process and Inversion
The source model is obtained by joint inversion of geodetic and seismic data. The static data includes 9 InSAR images, 2 SAR images, 23 GPS stations, as well as SPOT images. We also used the GSN broadband data downloaded from the IRIS DMC. We analyzed 29 teleseismic P waveforms and 19 SH waveforms selected based upon data quality and azimuthal distribution. Waveforms are first converted to displacement by removing the instrument response and then used to constrain the slip history based on a finite fault inverse algorithm (Ji et al, 2002). The epicenter location is based on the SCSN catalog (Lon.=-115.267°, ; Lat.=32.30°). The dip angle of F2,F3 and F4 are determined by static data, which are 75°, 60° and 50°, respectively. The strikes of the fault planes (F2, F3 and F4) were adjusted to match the rupture traces determined from SPOT and SAR images. The dip and strike of F1 are determined from seismic data, which are 355° and 45°, respectively. The Standard Sothern California 1D Crustal model is used here(Dreger and Helmberger,1990). See Wei et. al. (2011) for more details.Result
The first normal event has relatively small magnitude (~Mw6.3) and is determined by teleseismic P waves, most of the energy was released on F2 and F3 and mainly constrained by static data. Note that there is a time delay of about 15s between the first event and the following bilateral rupture.Cross-section of slip distribution
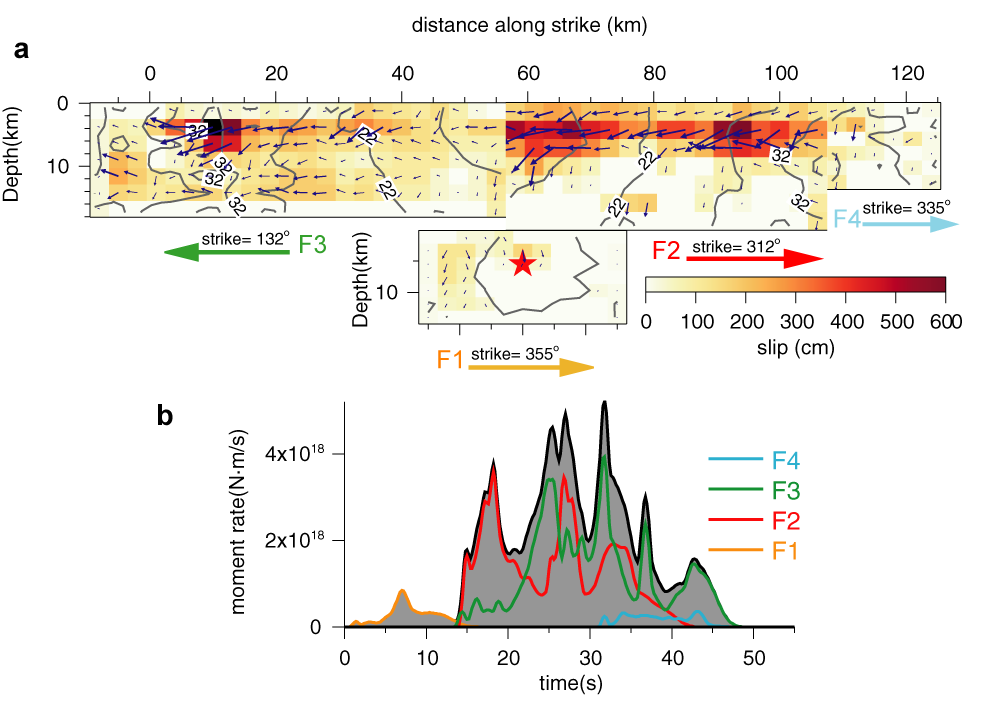
Figure 1: (a) Cumulative slip (arrows show slip vectors, and color coding shows amplitude) and isochrons of the seismic rupture. The rupture times are given relative to the onset of slip at the epicenter. Note large displacements around 17s and 27s on F2. (b) Source time function showing the time evolution of released moment rate. The contribution of each fault segment is color-coded.
Comparison of data and synthetic seismograms
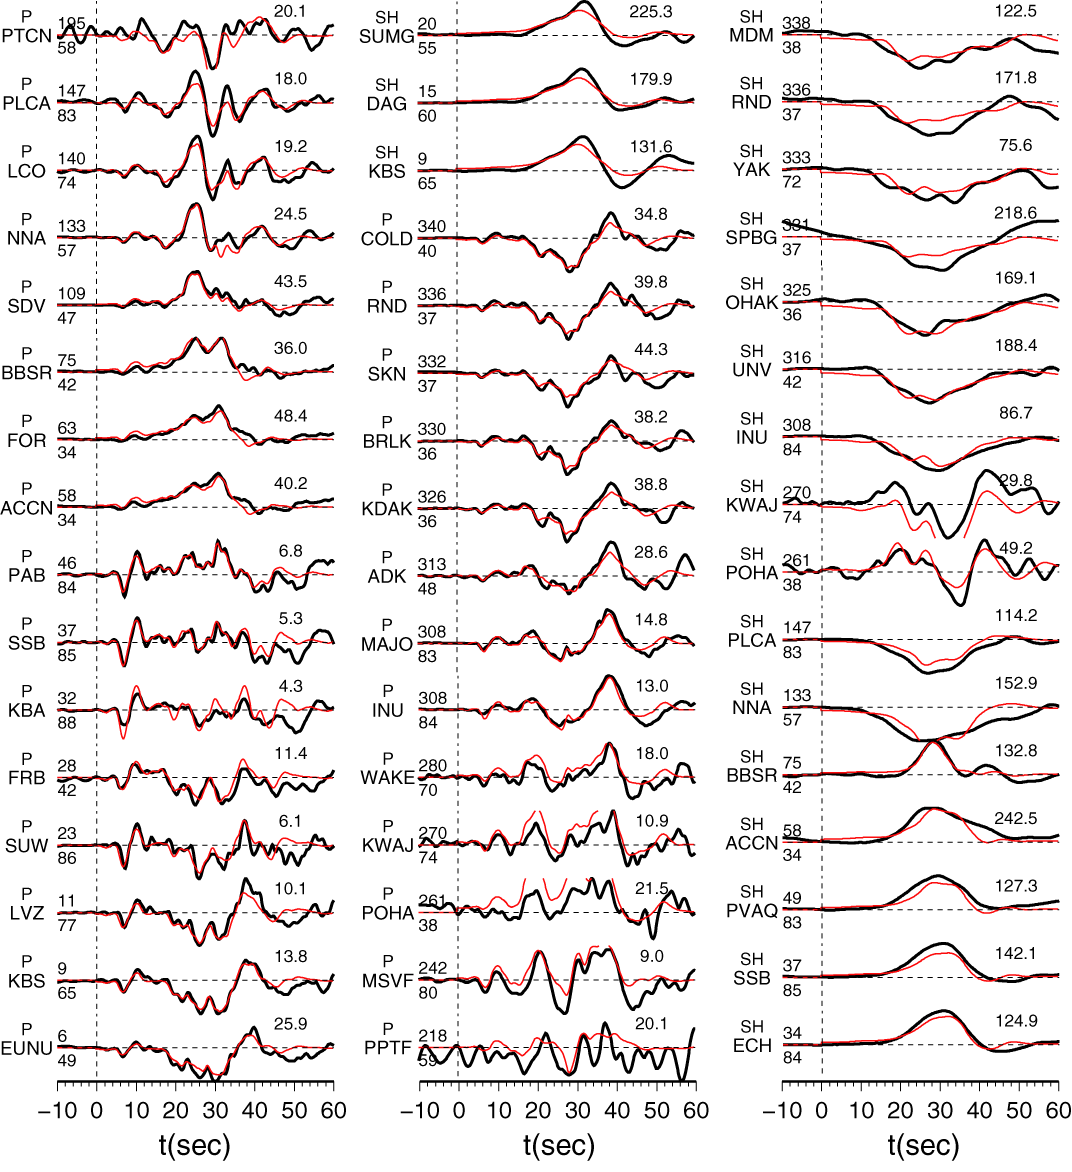
Figure 2: Comparison of the observed (black) and modeled (red) teleseismic seismograms (in displacement). Station names are indicated to the left of the traces along with the azimuths and epicentral distances in degrees. Peak amplitude in micron of data is indicated above the end of each trace.
N-S offsets and model prediction
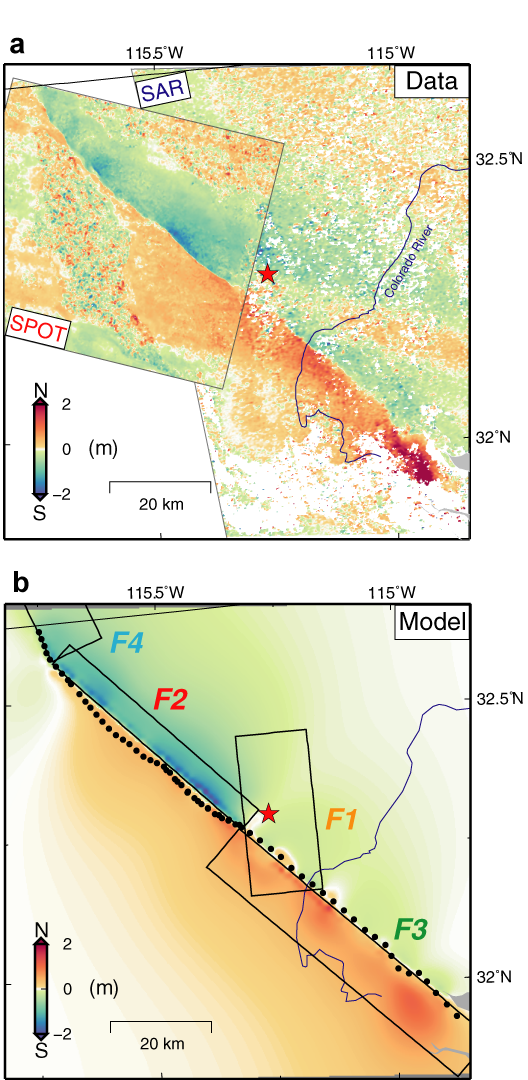
Figure 3: N-S surface displacements measured from sub-pixel correlation of optical and SAR images. (a) Map of near-field co-seismic ground displacement measured from sub-pixel correlation of SAR amplitude images25 and optical SPOT images26,27 acquired before and after the earthquake. The SPOT measurements are over-printing the SAR azimuth offsets. (b) Prediction from the preferred model. The color scale is blue (resp. red) for southward (resp. northward) displacements. Red star shows location of epicenter. Black dots delineate the fault trace as determined from the SAR and optical images correlations. Thin black rectangles show the idealized fault segments used in the modeling.
Comments:
Download
(Slip Distribution)
| SUBFAULT FORMAT | FSP FORMAT | CMTSOLUTION FORMAT | SOURCE TIME FUNCTION |
References
Wei, S., E. Fielding, S. Leprince, A. Sladen, J.P. Avouac, D. Helmberger , E. Hauksson, R. Chu, M. Simons, K. Hudnut, T. Herring & R. Briggs, Superficial simplicity of the 2010 El Mayor-Cucapah earthquake of Baja California in Mexico. Nature Geoscience. doi:10.1038/ngeo1213, 2011.Ji, C., D.J. Wald, and D.V. Helmberger, Source description of the 1999 Hector Mine, California earthquake; Part I: Wavelet domain inversion theory and resolution analysis, Bull. Seism. Soc. Am., Vol 92, No. 4. pp. 1192-1207, 2002.
Dreger, D.S., D. Helmberger, Broadband modeling of local earthquakes, Bull. Seism. Soc. Am.,80, 1162-1179,1990.
GCMT project: http://www.globalcmt.org/
USGS National Earthquake Information Center: http://neic.usgs.gov
Southern California Seismic Network: http://www.scsn.org/
Global Seismographic Network (GSN) is a cooperative scientific facility operated jointly by the Incorporated Research Institutions for Seismology (IRIS), the United States Geological Survey (USGS), and the National Science Foundation (NSF).
‹Back to Slip Maps for Recent Large Earthquakes home page