July/15/2003, Carlsberg Ridge, Mw7.6
Location of Epicenter |
Overview
|
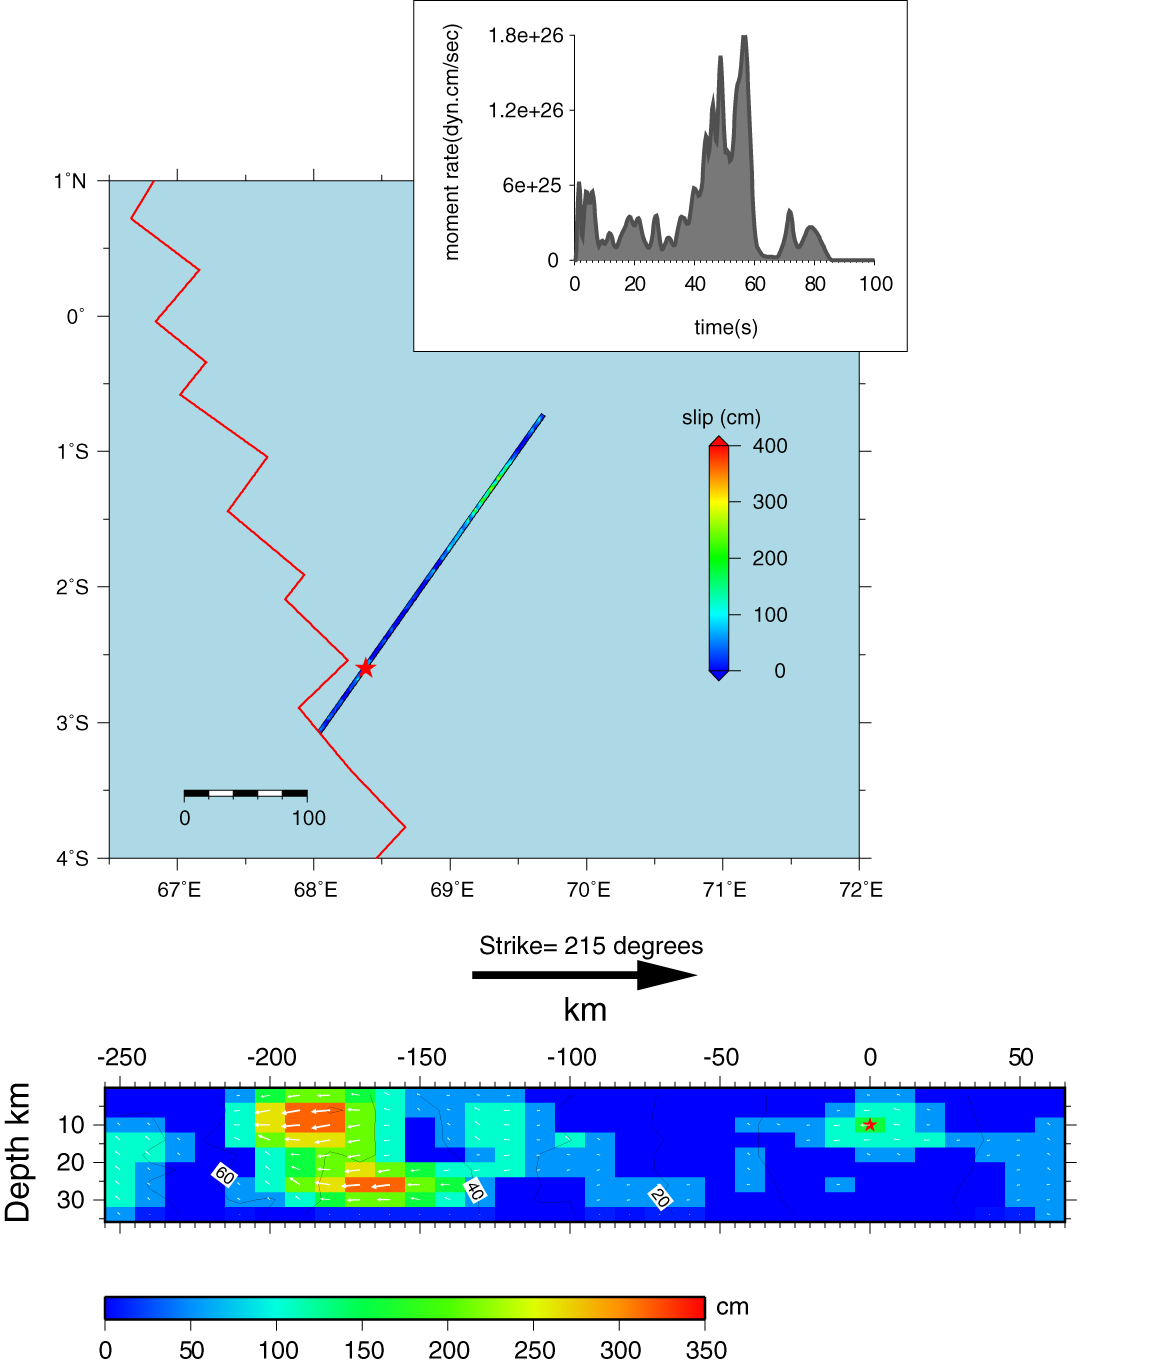
The Carlberg Ridge earthquake is located to the middle ocean ridge in the Arabian sea between India and Northern Africa. The ridge marks the boundary between the Indian and African plates. Near the epicenter the Indian plate is moving away from the African Plate at a rate of 33 mm/yr in a northeasterly direction. The Carlsberg Ridge is a slow-spreading ridge with rough topography and a depth that varies from 1700-4400 meters. The upper figure shows the location of the epicenter (star) and the map projection of the fault plane that is used in the finite fault inversion. The lower figure shows a depth profile of the slip model, the corresponding momentrate plot is shown in the upper figure. The slip model indicates the earthquake is a bilateral rupture event with two major asperities to the north and south of the epicenter. More close in data is needed to resolve more detail rupture process. |
DATA Process and Inversion
The source model is obtained by inversion of GSN broadband data downloaded from the IRIS DMC. We analyzed 58 teleseismic P waveforms selected based upon data quality and azimuthal distribution. Waveforms are first converted to displacement by removing the instrument response and then used to constrain the slip history based on a finite fault inverse algorithm (Ji et al, 2002). The epicenter location and point source mechanism (Global Moment Tensor Solution) are based on the information provided by NEIC (Lon.=68.38°, ; Lat.=-2.600°). 1D velocity model is extracted from the CRUST2.0 global tomography model (Bassin et al., 2000). The fault plane with strike of 261 degree and dip of 68 degree (based on GCMT solution) is used for the inversion.Result:
Cross-section of slip distribution
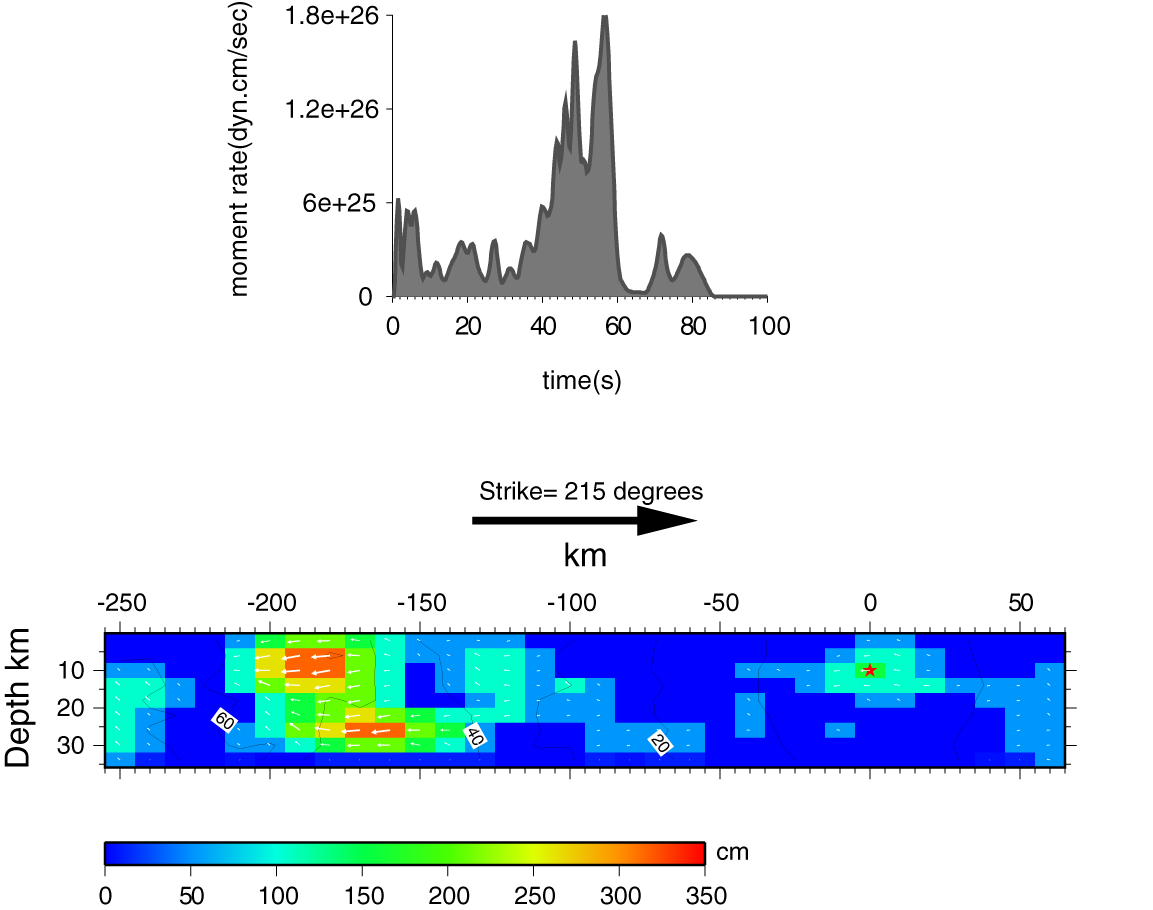
Figure 1: Upper: the source time function showing the time evolution of released moment rate. Lower: cumulative slip (arrows show slip vectors, and color coding shows amplitude) and isochrons of the seismic rupture. The rupture times are given relative to the onset of slip at the epicenter.
Comparison of data and synthetic seismograms
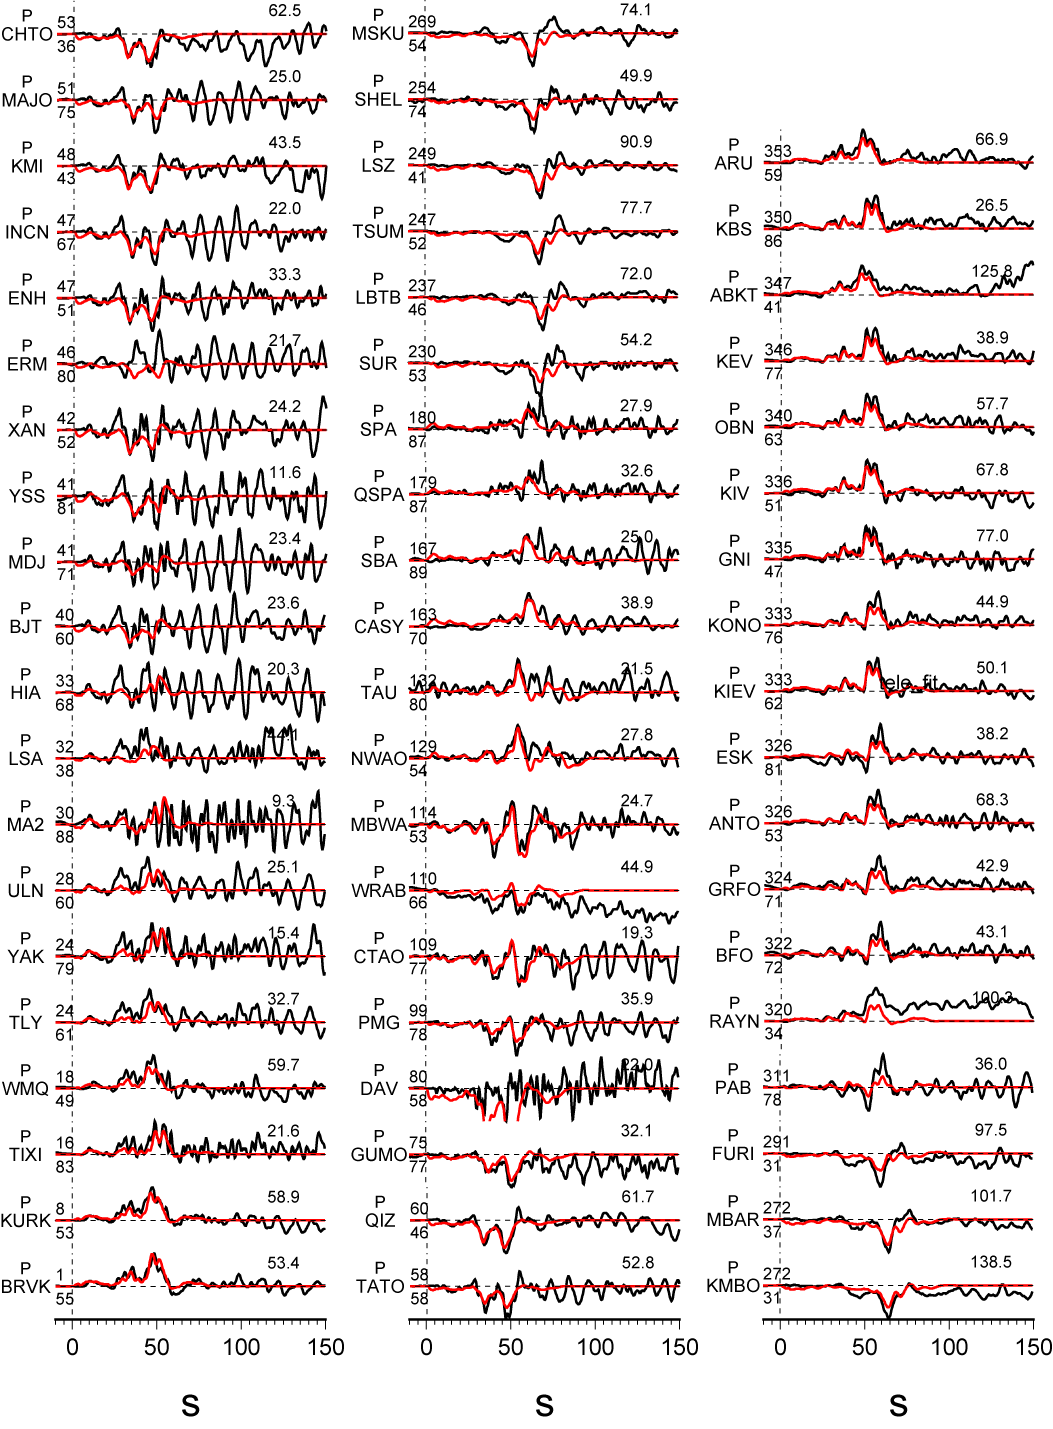
Figure 2: Comparison of the observed (black) and modeled (red) teleseismic seismograms (in displacement). Station names are indicated to the left of the traces along with the azimuths and epicentral distances in degrees. Peak amplitude in micron of data is indicated above the end of each trace.
Station Map
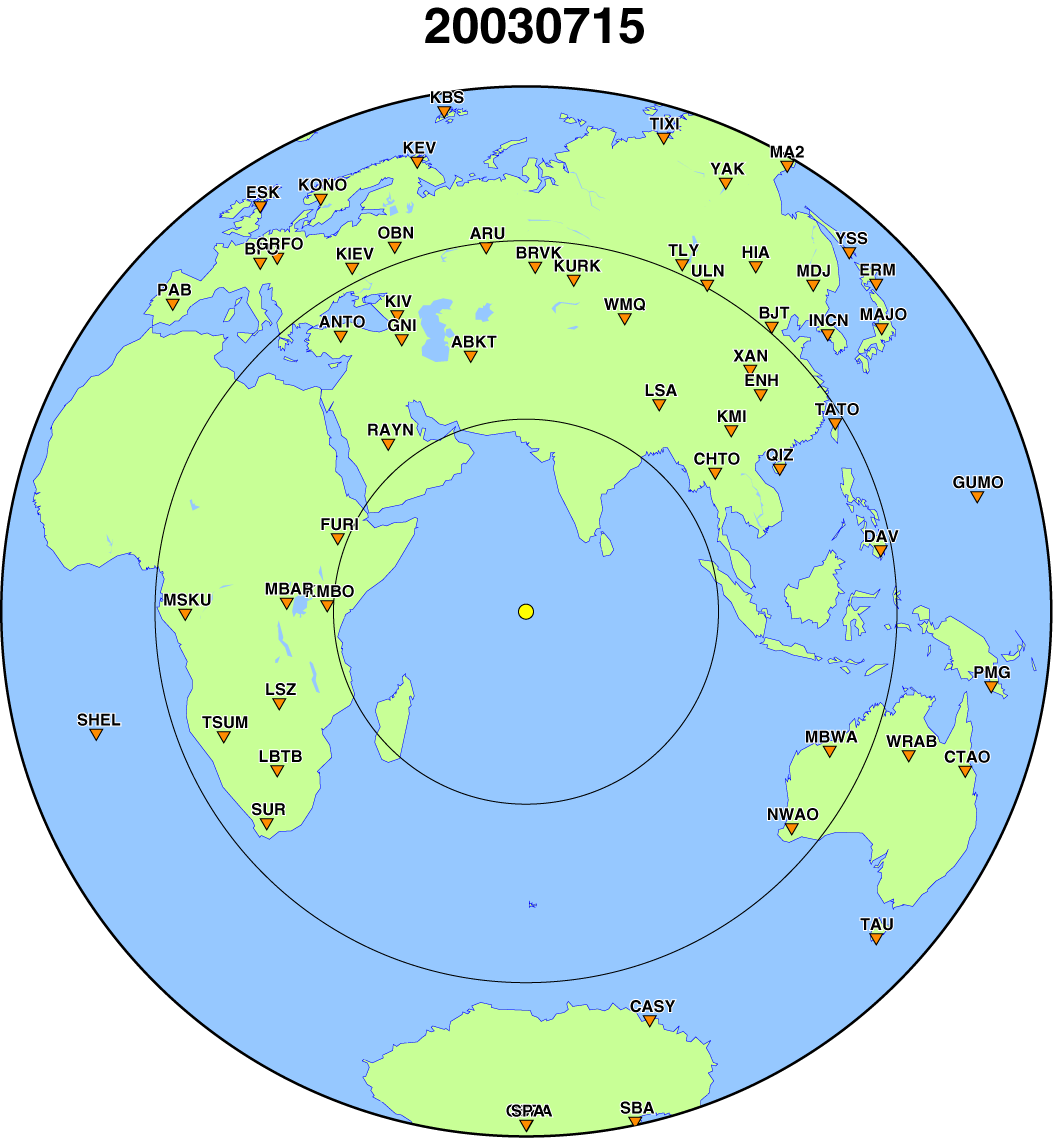
Figure 3: Station distribution (triangles) with station names on the top.
Comments:
Download
(Slip Distribution)
| SUBFAULT FORMAT | FSP FORMAT | CMTSOLUTION FORMAT | SOURCE TIME FUNCTION |
References
Ji, C., D.J. Wald, and D.V. Helmberger, Source description of the 1999 Hector Mine, California earthquake; Part I: Wavelet domain inversion theory and resolution analysis, Bull. Seism. Soc. Am., Vol 92, No. 4. pp. 1192-1207, 2002.Bassin, C., Laske, G. and Masters, G., The Current Limits of Resolution for Surface Wave Tomography in North America, EOS Trans AGU, 81, F897, 2000.
USGS National Earthquake Information Center: http://neic.usgs.gov
Global Seismographic Network (GSN) is a cooperative scientific facility operated jointly by the Incorporated Research Institutions for Seismology (IRIS), the United States Geological Survey (USGS), and the National Science Foundation (NSF).
‹Back to Slip Maps for Recent Large Earthquakes home page
© 2004 Tectonics Observatory :: California
Institute of Technology :: all rights reserved