Western United States Upper-mantle Anomalies - Dynamic Modeling Project
WestUS Home | People | Dangling Slab | Lithospheric Drip | Publications
Southern Sierra-Great Valley Lithospheric Drip Dynamics
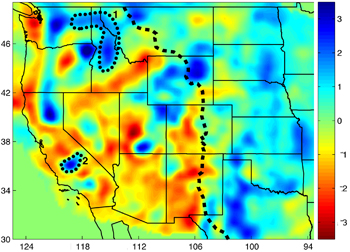
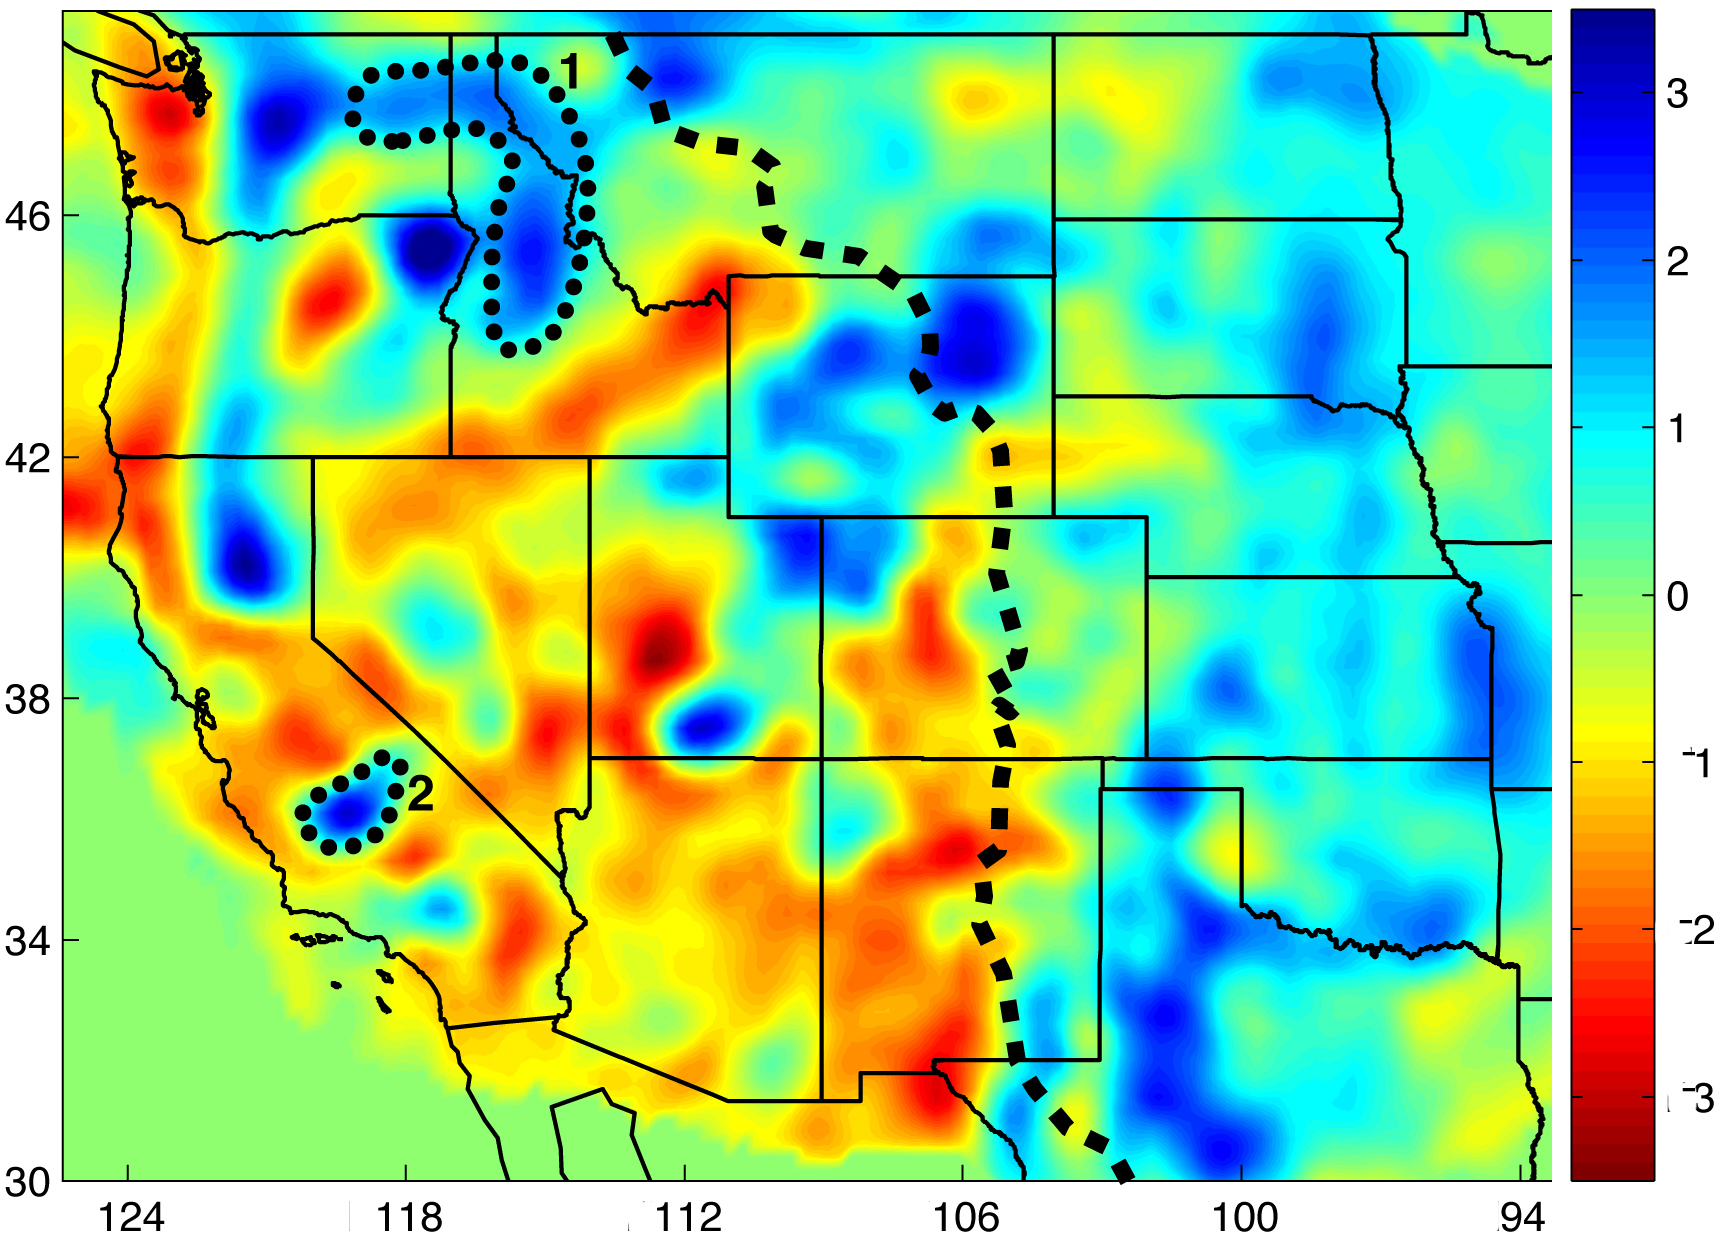
Fig. 1 Bird's eye view of structures lying beneath the surface of the Western U.S. - This horizontal tomographic section shows the structure of the upper mantle at 195 km depth. The color indicates the relative speed (vp) of the seismic waves when passing through a region. Red means the wave slows down, indicating the material there has low density. Blue means the wave speeds up, indicating the material has high density. The linear, high-density (blue) feature extending from northern California through Oregon and Washington is the "Gorda-Juan de Fuca" slab of the active Cascades subduction zone. Our research focuses on the region labelled #2. From: Schmandt and Humphreys, 2010a
|
Seismic images of what lies beneath the earth's surface reveal a large structure (labeled #2 in Figure 1) beneath the southern Sierra Nevada / Great Valley region of the western United States. Our goal is to figure out what this structure is and how it got there.
We can "see" the structure using a method called Seismic Tomography. This method measures the velocity of seismic waves as they pass through different areas of the Earth's interior. Like sound waves, the denser the material the waves travel through, the faster they go.
Figure 2 shows another tomographic image of this region, an east-west running, cross-sectional, close-up view of what lies beneath the western Sierra Foothills and Great Valley of California. The blue area corresponds to the region labeled #1 in Fig. 1. This upper-mantle structure is roughly elliptical (~300 km by ~200 km) and slants down toward the east. Its western end is attached to a crustal welt beneath the western Sierra Foothills and Great Valley.
Another technique enabling us to see below the Earth's surface is the Receiver Function technique. This method reveals regions closer to the Earth's surface than does Tomography. Figure 3 shows a receiver function image of the same structure as in Figure 2. A strong Moho positive conversion is seen, which extends eastwards above this structure, and then disappears westwards into the zone of crustal attachment. Much of the region is ~1-2 per cent fast, while an ~100 km by ~50 km (depth by width) core area is ~3-4 per cent fast.
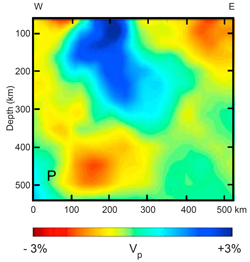
Figure 2. Seismic anomaly below southern Sierra Nevada - This vertical tomographic section across the southern Sierra Nevada region shows a profile of a seismic anomaly (blue region) which we argue is a piece of the overlying North American Plate that has broken off. From: Schmandt and Humphreys, 2010b
|
From geological observations obtained on the Earth's surface directly above the anomalous structure, we know that the area where the structure is attached to the overlying crust lies beneath large-volume, Early-Cretaceous, batholithic rocks, which underlie much of the Great Valley (Saleeby, 2007). In contrast, the eastern end of the anomalous structure lies below rootless, Cretaceous, batholithic rocks of the Sierra Nevada. Sandwiched between those lithosphere rocks and the eastern end of the anomalous structure is asthenospheric mantle that is believed to have filled in the gap created by the sinking of the structure's eastern end.
We argue that this anomaly was formed by a convectively mobilized mantle wedge that formed beneath the Sierra Nevada batholith. Based on mantle xenolith studies, this mantle wedge consisted of enriched peridotites at deep levels (80-125 km), and of eclogitic cumulates (arclogite root) of the deep batholith source area at shallower levels (80-40 km). We argue that the mantle wedge assemblage was quenched to a lithospheric geotherm at the end of the Cretaceous by protracted flat-slab subduction (Saleeby et al., 2003).
To test our idea of this being a mantle wedge that was created in the early Cenozoic time (4 million years ago), we perform a series of thermo-mechanical model runs. We test the gravitational stability of the quenched mantle wedge, as well as the subsequent effect of opening an underlying slab window in the Neogene (Atwater and Stock, 1998).
We constrain the initial and boundary conditions in the model (Fig. 4) using a wealth of published data on lithospheric structure and composition. Since deep crustal rheology (flow of solids) is the most poorly constrained parameter, we have run the model extensively with different values of crustal rheology, and have evaluated the results primarily on the basis of how the model predictions compare with observations:
- timing and source characteristics of volcanism
- timing and amount of rock uplift in the Sierra Nevada and subsidence in the Great Valley
- timing and geometry of extensional tectonism along the eastern Sierra Nevada and adjacent Basin and Range province (Le Pourhiet et al., 2006; Saleeby et al., 2012a)
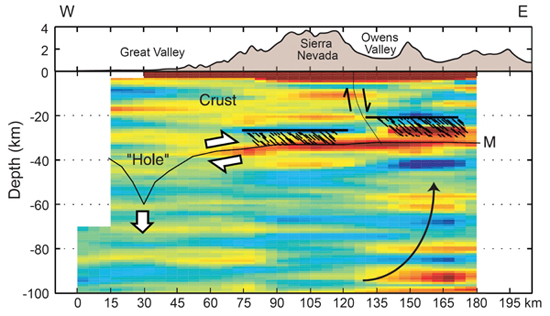
Figure 3. Seismic Receiver Function image - taken along approximate trace of Figure 2, showing strong positive conversions of Moho along zone of arclogite root detachment from the base of the crust, and loss of Moho conversions westwards into zone of residual attachment of the root to base of crust (after Zandt et al., 2004). "Hole" in Moho corresponds to crustal welt where seismic refraction studies have shown lower crust to thicken. Diagonal dark lines depict seismic anisotropy resolved along zone of root detachment, and arrows show diagrammatic upper mantle flow pattern.
|
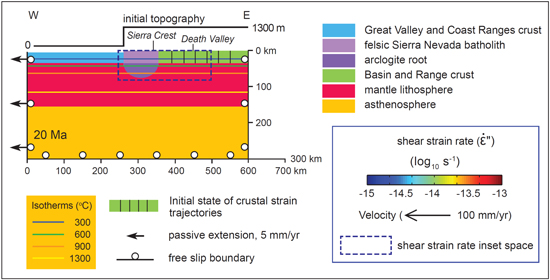
Figure 4. Summary of initial- and boundary-conditions assumed in the thermo-mechanical model of southern Sierra Nevada-Great Valley region convective instability - Model trace is ~E-W, along approximate trace of Figure 2 tomographic section. After: Le Pourhiet et al., 2006; and Saleeby et al. 2012a
|
Figure 5 presents a summary of our model results (Saleeby et al., 2012a & b). We start the model 20 million year ago (Fig. 4) with the imposition of a slab-window thermal perturbation beneath the quenched mantle wedge, as well as 5 mm/yr of passive extensional strain.
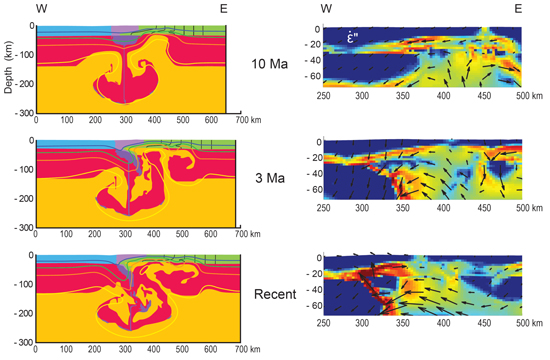
Figure 5. Selected phase solutions (left-hand panels) and coincident shear strain rate solutions (right-hand panels) corresponding to the region defined by the inset box area in Fig. 4. for preferred thermo-mechanical model of southern Sierra Nevada-Great Valley anomaly. Note change in scale of inset boxes. Color coding of phases and values of isotherms given in Figure 4. The depressed 1300 °C isotherm for “Recent” time is interpreted as the approximate outline of the resulting high velocity anomaly (compare to ~+1 % Vp isopleth of Figure 2).
|
As time progresses, the gravitationally unstable arclogite root sags, inducing a lithosphere-scale convective instability. Crustal thinning and mantle lithosphere attenuation along the eastern Sierra region lead to lithospheric break off at 10 Million years ago, which in timing and location is consistent with the initiation of the Sierra Nevada microplate (Busby and Putirka, 2009).
Continued sagging of the arclogite root promotes suction of the lower crust westwards along the root-felsic batholith interface, which promotes separation of the root, as well as its progressive east-to-west delamination. Shear strain rate insets on Figure 5 show high rates of shear along a lower crustal channel, which draws lower crust into the zone of root detachment, eventually forming a crustal welt along the west side of the Sierra Nevada.
Delamination progressively accelerates following lithosphere break off, and attains its most vigorous phases by about 3 Million years ago. At this time the eastern Sierra Nevada undergoes a pronounced rock uplift phase, while in the Great Valley, the Tulare sub-basin forms by delamination-induced focused subsidence. Model predictions for delamination-induced rock uplift and subsidence along the model trace (Fig. 6) agree quite well with observational constraints (Saleeby et al. 2012b). The sharp spikes near the eastern end of the model represent the surface breaching of normal faults, which root westwards into the lower crustal channel.
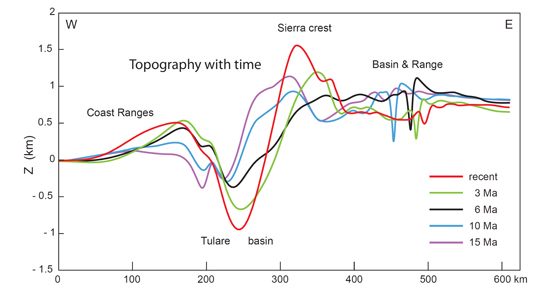
Figure 6. Model predictions for vertical displacement [of what?] through time along preferred thermo-mechanical model trace - Rock uplift of the Sierra Nevada does not take into account the feedback effect of coincident exhumation and Tulare basin loading, which could be as much as ~400 m along the Sierra crest. Subsidence in Tulare basin does not take into account sediment loading, which could add as much as ~500 m to total subsidence (Saleeby et al., 2012b)
|
Our interpretation:
-
We interpret the principal thermal anomaly in our "Recent" time model solution as the area inside the depressed 1300°C isotherm (Fig. 5), which is in reasonable agreement with the area inside the ~1 per cent isopleth of the Figure 2 tomogram.
-
We further interpret the ~3 per cent fast core area of the tomogram to be the "dangling" segment of the partially delaminated arclogite root, as predicted in the 3 Ma and “Recent” time frames of Figure 5.
These results suggest that by the careful posing of initial- and boundary- conditions, along with multi-phase rheological parameters, with a strong detailed observational basis, our modeling techniques can successfully predict a wide array of surface geologic responses to the convective removal of the mantle lithosphere beneath the region, as well as the first-order structure of the instability as imaged seismically, and the governing dynamics of the system.
Contacts: Laetitia Le Pourhiet, Jason Saleeby, and Mike Gurnis
|