|
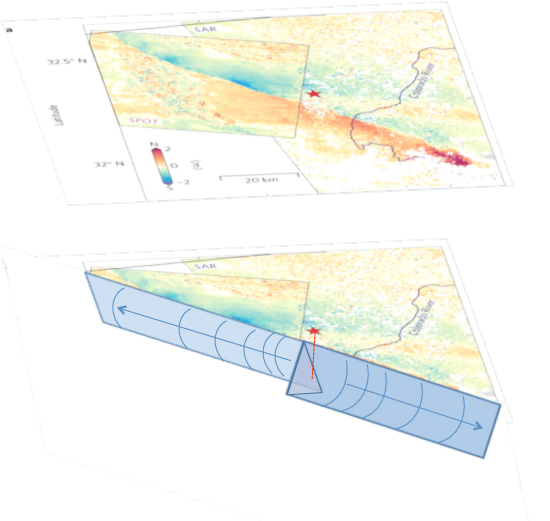
The upper panel shows the north-south displacement of the Earth's surface during the 2010 Baja California earthquake. The red star indicates the epicenter. Surface colors indicate the amount and direction of surface displacement, blue being southward motion, red northward. In the upper panel, a clear asymmetry is seen in the distribution of strain on either side of the epicenter. This image is obtained from subpixel correlation of optical and SAR images.
|
The lower panel shows model results of the underlying ruptured faults. An unexpectedly complex geometry is seen: rather than one vertical fault running the length of the rupture, two main faults are seen, each tilted away from the vertical in opposite directions from one another. The fault running northwest from the epicenter is tilted toward the Mexicali Valley, while the fault running southeast is tilted away.
CREDIT: Anthony Sladen, Geoazur
|